SDR2 Project - Passband Testing
I’ve been working on a homebrew SDR project for a few months now. Things are finally starting to work. The receiver sounds pretty good, but there are many parameters in the design that have been chosen somewhat arbitrarily. Therefore, I’ve been trying to do some systematic testing to figure out what is optimal. Some of these things may be too subtle to judge by ear.
Test 1: Experimenting With Hilbert Group Delay Assumption
The receiver uses the classic quadrature mixer method to produce base-band I/Q signals. A Hilbert transform is implemented on the Q channel to provide the 90° phase shift that is used to achieve opposite sideband suppression. In order for this to work correctly we need to make sure that the I channel is delayed by the same amount as the Q channel. In other words, the I channel needs to be artificially delayed by the group delay of the Hilbert transformer that exists on the Q channel.
The accuracy of this I/Q synchronization is critical to the quality of the opposite sideband suppression provided by the Hilbert transformer.
I think the classic analog phasing HDR rigs achieved the same by doing a few things:
- Using high-tolerance parts to provide good electronic symmetry between the I and Q paths.
- Ensuring physical symmetry between the I and Q paths.
- Using a +45° and -45° shift in the I and Q paths respectively, instead of putting the entire 90° shift in the Q path like the SDR rigs do.
Per the DSP reference (see Lyons 1st ed. pg. 202), the group delay of a linear phase FIR filter with S taps (an odd number) is:
Godd = ((S - 1) ts) / 2
Where Godd is the delay and ts is the sample interval, both in seconds. That’s the number that was originally coded into my firmware.
I’ve read some articles that suggest that “tuning” this delay a tap or two can help to compensate for imperfections in the hardware implementation and may result in improved opposite sideband suppression performance. The purpose of this experiment is to evaluate this parameter.
NOTE: After more research, I found a good paper from 2012 written by Oscar Steila, IK1XPV that talks about this issue in detail and contains references to several academic papers on the topic. It turns out that this phenomenon is commonly called “I/Q imbalance.” There are two important take-aways:
- The imbalance could actually be a frequency-dependent factor in a multi-band rig. The simple tap delay adjustment shown on this page may not be sufficient to fix the problem across a wide range of operating frequencies.
- The imbalance refers to differences in amplitude as well as phase. My simple receiver assumes the amplitudes of the I and Q channel are the same. I will need to do some more testing to demonstrate the implication of this assumption.
Test Setup
One of the great things about SDR rigs is that systematic performance testing can often be achieved without much additional hardware. This test is an example.
I’d like to plot the audio passband of my SDR rig on both sides of zero-beat to understand (a) the shape of the audio passband and (b) the quality of the suppression of signals on the “other side of zero.”
The intuitive way to perform this test is to tune the rig’s VFO to a fixed frequency and sweep an RF signal across both sidebands around the center VFO. Ideally the amplitude of the resulting demodulated audio would be (a) flat across the desired sideband and (b) zero across the opposite sideband.
To make this test easier I’ve changed things a bit. Instead of sweeping a test signal across the passband, I play a fixed carrier into the antenna port and sweep the rig’s VFO backwards through the same range, measuring the audio power (actually Vrms) at each point. When the VFO is below the test carrier the upper sideband response is tested and when the VFO is above the test carrier the lower sideband response is tested.
Since I’ll be running this test a lot I’ve added a feature to the rig’s firmware that performs this sweep/measurement sequence quickly. The test spends 100ms at each frequency of the sweep in 100 Hz increments. The audio power is observed at each frequency and can be dumped out and plotted for analysis.
Test particulars:
- Fixed carrier at 7,200 kHz.
- Sweep VFO from 7,195 kHz to 7,205 kHz in 100 Hz steps.
- 100ms at each frequency.
- Audio power was measured across 256 samples taken at 8 kHz. This is a RMS aggregation of the voltage samples.
- I generated the Hilbert impulse response using my homebrew implementation of the Parks-McClellan algorithm.
- My Hilbert transform was using 51 taps. The passband used for the filter generation was set to 0.02 * fs -> 0.48 * fs. (That tap count and passband range are assumed parameters that should be experimented with.)
- There is also a 91-tap low-pass filter with a cutoff of 3.5 kHz.
- My rig was running in LSB mode.
I ran four tests with four different “tweaks” the delay on the I channel that compensates for the group delay of the Hilbert transformer. It turns out this group delay makes a measurable difference!
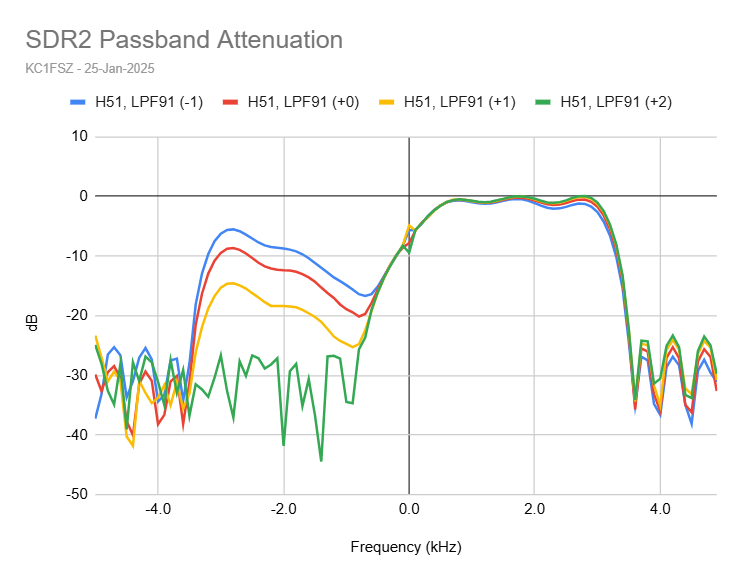
The positive frequencies on the right side of the x-axis represent the desired sideband and the negative frequencies on the left represent the opposite sideband.
Notice a few things:
- First off, the shape of the desired passband is pretty good. The “lows” are rolled off a bit much (below 500 Hz), but this is a known behavior of the Hilbert transformer filter. More on this later: it would be nice to improve this, possibly with more Hilbert taps.
- The passband rolls off pretty sharply starting at +3.5 kHz. This makes sense since my rig has a 91-tap low-pass filter with this transition frequency.
- There are ripples in the passband and stopband, as expected.
Focusing on the unwanted sideband, the red plot (+0) is the baseline delay assumption documented above. Opposite sideband suppression is not great at around -2.1 kHz, only -10dB. Notice that shortening the delay by one tap (blue trace) gets even worse, and increasing the delay by one tap (yellow trace) gets a bit better. Increasing the delay of the I channel by 2 taps gives the best result (green trace) with around -25dB of opposite sideband suppression across the entire audio passband. That should be good enough for my purposes.
Test 2: Experimenting With I/Q Amplitude Imbalance
Test 1 explored the effect of phase differences between the I and Q channel. Test 2 will look at the effect of amplitude differences.
A multiplicative factor was added to the firmware that allows the amplitude of the I channel to be scaled up/down relative to the Q channel. Four trials were run: down 5%, flat, up 5%, up 10%.
Test Setup
Everything with the setup was the same as Test 1 above. The test was run using the +2 tap group delay adjustment that was determined during the previous test.
The passband plots are shown here:
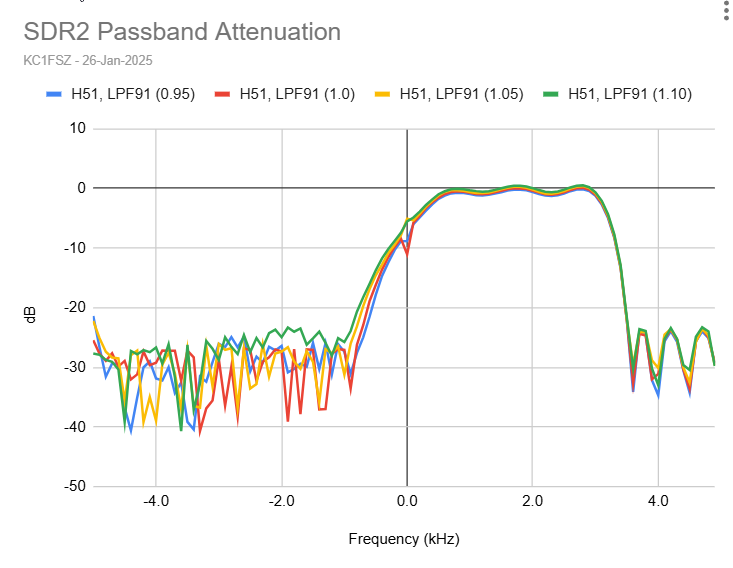
Within the range tested the impact of amplitude imbalance is very small. It looks like the “flat” trace (i.e. no adjustment to the amplitude of the I channel) gives the best performance, demonstrating that the circuit is well balanced to begin with. The green trace shows that the extreme situation (+10%) gives the worst performance, as expected.
My conclusion is that amplitude balance is important, but not as important as phase balance.